Updated on October 9th, 2025 by Bob Ciura
Spreadsheet data updated daily
The Russell 2000 Index is widely recognized as the premier benchmark for small-cap U.S. stocks. Historically, small-cap stocks have outperformed their larger counterparts, making the Russell 2000 Index an intriguing avenue for discovering new investment opportunities.
To assist you in your investment journey, you can download a free Excel list of Russell 2000 stocks, complete with essential financial metrics such as dividend yields and P/E ratios, by clicking the link below:
Table Of Contents
Russell Index Overview & Construction
The Russell 2000 Index is a subset of the Russell 3000 Index. Maintained by FTSE Russell, the Russell 3000 Index includes the 4,000 largest publicly traded U.S. companies. Despite its name, the Russell 3000 actually comprises 4,000 securities.
This index undergoes annual reconstruction and quarterly updates to include new IPOs (Initial Public Offerings).
The Russell 3000 Index is divided into several subgroups:
- Russell 1000: The 1,000 largest companies in the Russell 3000 Index
- Russell 2000: Companies ranked 1,001 to 3,000 by size
- Russell Microcap Index: Companies ranked 2,001 to 4,000 (overlapping with the Russell 2000)
How To Use The Russell 2000 Stocks List To Find Investment Ideas
An Excel document containing financial data for each Russell 2000 stock can be incredibly beneficial. This document becomes even more powerful when you know how to manipulate data within Microsoft Excel.
This article will guide you through two actionable investing screens using the Russell 2000 Stocks List.
The first screen targets stocks with price-to-earnings ratios below 15, identifying small-cap stocks trading at attractive valuations while minimizing the risks associated with overpriced securities.
Screen 1: Small-Cap Value Stocks With Price-To-Earnings Ratios Below 15
Step 1: Download the Russell 2000 Stocks List from the link provided above.
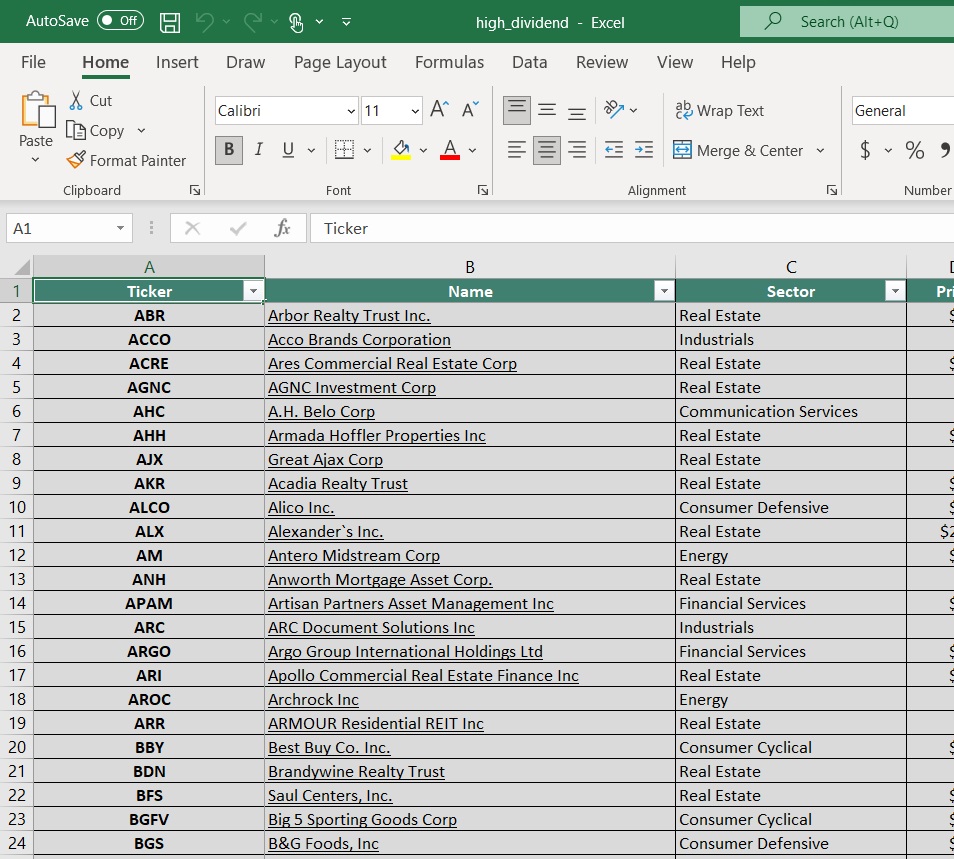
Step 2: Highlight all columns.
Step 3: Navigate to the “Data” tab and click “Filter.” Refer to the image below for guidance on steps 2 and 3.
Step 4: In the P/E ratio column, click the filter arrow, select “Number Filters,” then choose “Between” and set the range to 0 and 15. See the image below for assistance.
The remaining stocks in this spreadsheet will be Russell 2000 stocks with P/E ratios below 15 and positive earnings.
Next, we will implement a screen for Russell 2000 stocks that offer high dividend yields and reasonable payout ratios.
Screen 2: High-Yield, Reasonable Payout Ratio Small-Cap Stocks
Step 1: Download the Russell 2000 Stocks List and set the columns to “Filter” (refer to steps 2 and 3 of Screen 1).
Step 2: In the Dividend Yield column, click the filter arrow, select “Number Filters,” then choose “Greater Than or Equal To” and enter 0.05.
Step 3: In the Payout Ratio column, click the filter arrow, select “Number Filters,” and choose “Between,” setting the range to 0 and 0.60. Refer to the image below for guidance.

The remaining stocks will have dividend yields of 5% or more and payout ratios below 60%, revealing small-cap dividend stocks worth further research.
With this knowledge, you are now equipped to use the Russell 2000 stocks list to uncover investment ideas.
Why Invest In Stocks From The Russell 2000 Index
The Russell 2000 Index includes U.S. stocks ranked 1,001 through 3,000 by market capitalization. It serves as an excellent benchmark for small-cap stocks, with the average market capitalization around $3 billion.
This matters because investing in small-cap stocks offers several advantages:
- Small-cap stocks often grow faster than larger companies due to less competition and more room for expansion.
- Many small-cap stocks fall outside the purview of larger institutional investors, leading to less demand and better buying opportunities.
Consequently, small-cap indices like the Russell 2000 typically present more mispriced investment opportunities compared to large-cap indices like the S&P 500.
Russell 2000 Monthly Performance
The Russell 2000 ETF (IWM) achieved total returns of 3.2% in September 2025, underperforming the S&P 500 ETF (SPY), which returned 4.3% during the same period.
While small-cap stocks have historically outperformed over the long term, this trend has not held true over the past decade. The S&P 500 ETF has delivered annualized total returns of 14.76% compared to 9.31% for the Russell 2000 ETF.
This counterintuitive finding may be attributed to the exceptional performance of large technology companies, which have significantly influenced the S&P 500’s superior returns over the last ten years.
Final Thoughts & Further Reading
The Russell 2000 Index List is a valuable resource for identifying small-cap investment opportunities, but it is not the only source of excellent investments.
If you seek exposure to stable large-cap stocks with solid dividend growth prospects, consider exploring other databases that may be more beneficial than the Russell 2000 Index List.
Thanks for reading this article. Please send any feedback, corrections, or questions to support@suredividend.com.